 Skip to main content
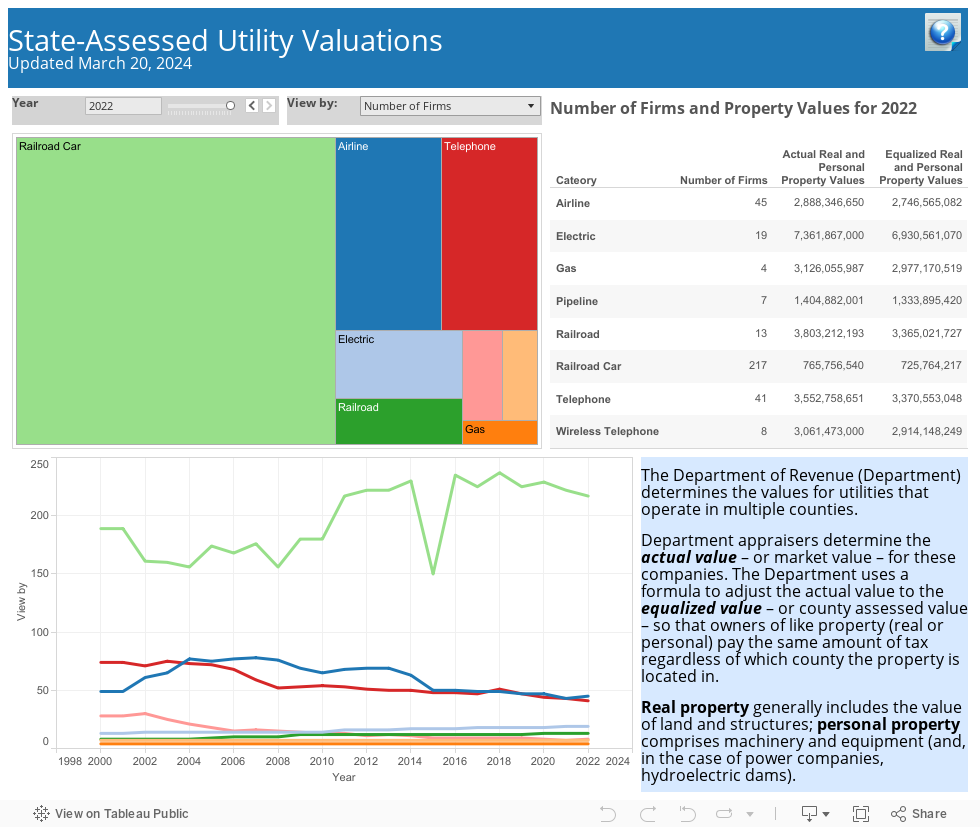
This interactive data graphic presents information from the property tax statistics. Hover over a county on the map or bar chart for more details, and immediately see the data change.
The graphic allows you to view information by:
- Number of firms by type of utility
- Actual values of real and personal property
- Equalized values of real and personal property
Note: Data visualizations must be viewed in the Google Chrome, Firefox or Safari browsers.
Hover over the question mark in the upper right hand corner of the visualization for additional information about using charts as filters, and other filters provided.