 Skip to main content
Interactive data visualization for the 2024 tax exemption study coming soon.
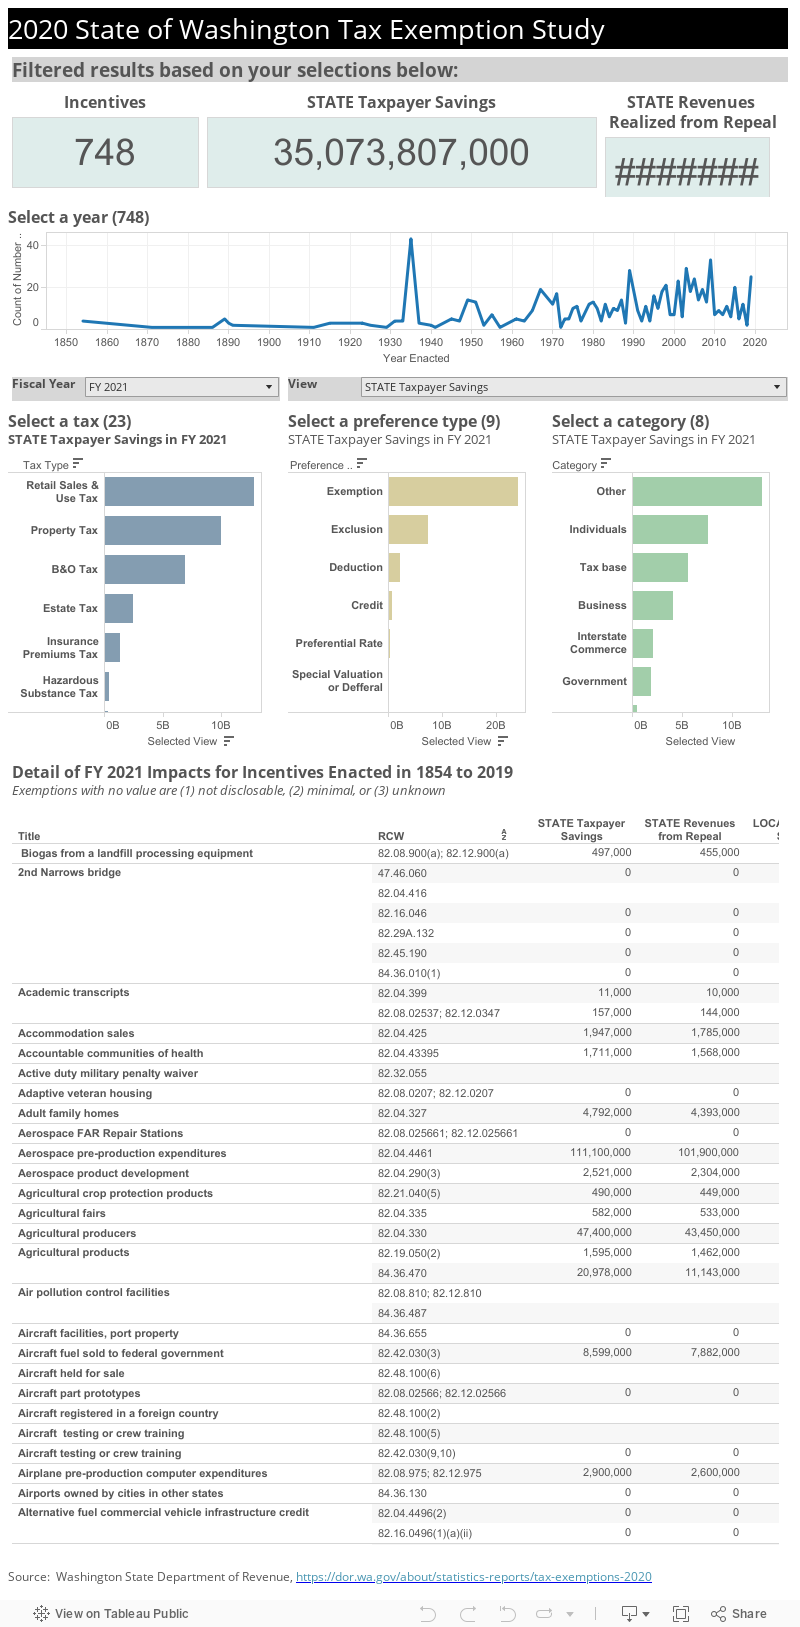
This interactive data visualization presents data from the tax exemption study. Interactive features let you drill down into charts and graphs for more details, and immediately see the data change.
The visualization has four tabs so you can look at exemptions by:
- Year of enactment
- Tax Type
- Type of Preference
- Category of taxpayers
Note: Data visualizations must be viewed in the Google Chrome, Firefox or Safari browsers.
Hover over the question mark in the upper right hand corner of the visualization for additional information about using charts as filters, and other filters provided.